Measured report · 02
How much accuracy does lower-resolution object detection trade away?
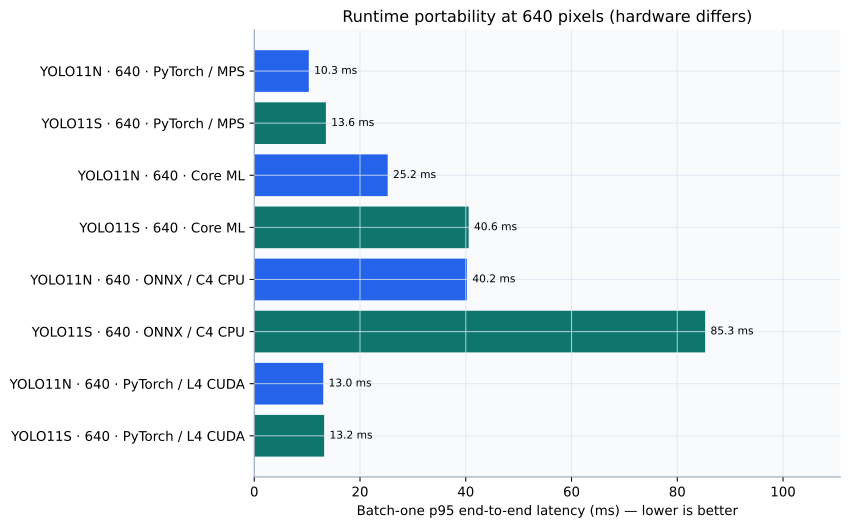
We measured six local YOLO11 configurations on all 5,000 COCO validation images, then checked 640-pixel deployment on Cloud Run L4 GPU, Core ML and C4 CPU.
5,000
validation images
6
local configurations
46.37%
selected mAP50–95
13.55 ms
selected p95 latency
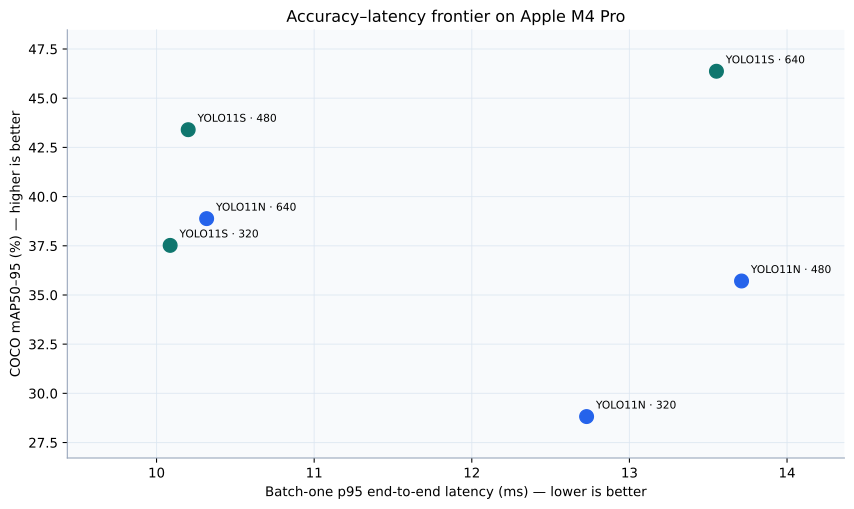
The frozen rule selected YOLO11S at 640 pixels: it was the lowest-p95 configuration within 2.0 absolute mAP50–95 points of the YOLO11S 640 reference.
Its measured 13.55 ms p95 implies 36.9 aggregate frames per second after reserving 50% latency headroom. That is a capacity estimate, not a production guarantee.
Measured frontier
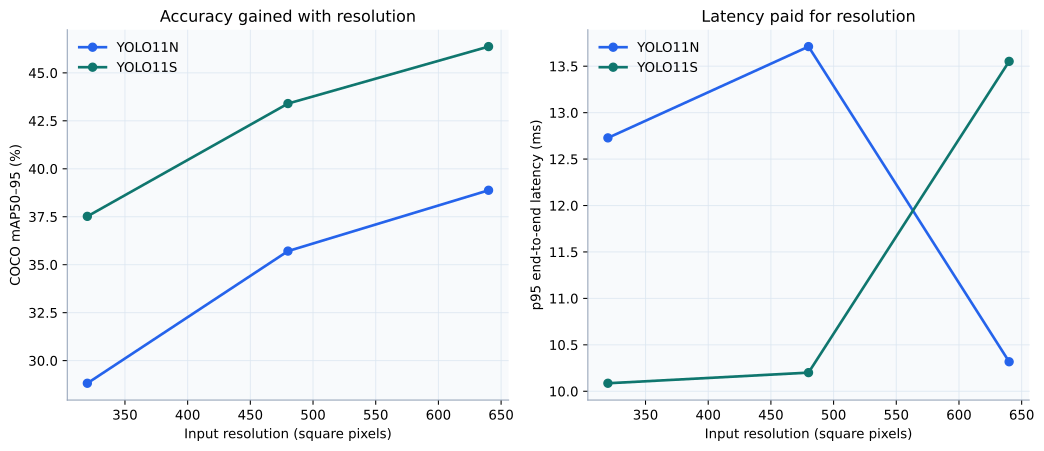
Resolution bought accuracy, but not proportional latency
Every accuracy value uses the full COCO 2017 validation split. Latency is end-to-end batch-one prediction after 20 warm-ups.
All local results
The six configurations behind the decision
| Model | Input | mAP50–95 | Person AP | p50 | p95 | p99 | Safe FPS |
|---|---|---|---|---|---|---|---|
| YOLO11N | 320px | 28.82% | 39.24% | 10.34 ms | 12.73 ms | 17.73 ms | 39.3 |
| YOLO11N | 480px | 35.71% | 47.29% | 9.83 ms | 13.71 ms | 16.95 ms | 36.5 |
| YOLO11N | 640px | 38.88% | 51.76% | 7.77 ms | 10.32 ms | 21.64 ms | 48.5 |
| YOLO11S | 320px | 37.52% | 46.57% | 8.00 ms | 10.09 ms | 19.62 ms | 49.6 |
| YOLO11S | 480px | 43.40% | 54.27% | 8.87 ms | 10.20 ms | 15.20 ms | 49.0 |
| YOLO11S · selected | 640px | 46.37% | 57.94% | 11.32 ms | 13.55 ms | 23.40 ms | 36.9 |
Business sizing
Translate latency into an inspection-rate hypothesis
At the selected p95, the 50%-headroom model supports the following evenly scheduled camera scenarios before decoding and application I/O.
18
cameras at 2 fps each
7
cameras at 5 fps each
3
cameras at 10 fps each
Frozen protocol
Inputs, labels and execution
- Dataset
- COCO 2017 validation split
- Evaluator
- pran-vision-deployment/1.0.0
- Executed
- 2026-08-24
- Local hardware
- Apple M4 Pro, 16-core GPU, PyTorch MPS
- Selection
- Lowest p95 local latency within 2.0 absolute mAP50-95 points of YOLO11s at 640 px.
- Cloud execution
- One NVIDIA L4 on Cloud Run in europe-west4 ran both 640-pixel PyTorch/CUDA configurations. The original us-central1 one-L4 quota preference remained pending; C4 CPU/ONNX stays separately labelled.
Download evidence
Results, method and reproduction commands
No email gate. Model hashes, environment versions and runtime-specific raw timings are included.
Sizing an inspection system? Start with the site constraints and the evidence needed to clear a production gate.
Plan a vision feasibility sprint